As participants complete your survey, our platform powered by AI analyzes the responses and delivers real-time reports as minimum reporting thresholds are met. You can access your listening event reports during the listening event or after it closes. (Results display only when the minimum response threshold for reporting is met.) You can also apply a variety of filters and options to uncover additional insights.
This article walks through the high level of each and links out to the step-by-step:

Access the Reports Dashboard
You access reports from the Manage Surveys platform page or from the My Surveys page in the Program Builder (self-service only).
In the main Perceptyx Platform:
In the top navigation bar, click Surveys.
The Manage Surveys page appears.
Identify the listening event you want to view reporting for and click View Reporting.
The Results Dashboard displays. Within this view, you can select the report you want to view, apply your filters, and gather your insights.
In the main Program Builder (Self-Service):
Hover over the left navigation bar, then click My Surveys.
The My Surveys page appears.
Identify the listening event you want to view reporting for and click the event name.
The Results Dashboard displays. Within this view, you can select the report you want to view, apply your filters, and gather your insights.

Reports Dashboard Overview
The Results Dashboard enables you to view a variety of reports for your selected listening event. The Results Dashboard is divided into a left navigation bar (enabling you to access all available reports and apply filters) and the main area (where the report information displays).

The types of reports that are generated for a survey depends on the types of questions in the survey and whether the creator configured trend or turned on action planning for the survey. All possible reports are listed below.The panel stays open as you move between reports unless you click the arrow icon (top) to collapse it.
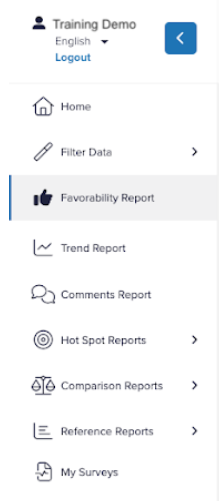

Available Reports
The types of reports that are generated for a survey depends on the types of questions in the survey and whether the creator configured trend or turned on action planning for the survey. All possible reports are listed below. Click a report name to view an article with full details about the report.
Favorability Report: Displays the percentage of participants that responded favorably or unfavorably by question or by category group. For each question, you can explore the largest gaps between those who answered favorably and unfavorably, look at the demographic profile for responses, view trending, and create an action plan to address an indicated challenge.
Trend Report: Displays results for each question and category for the current survey, as well as past surveys where matching questions were asked.
Comments Report: Provides multiple perspectives on employee comments, ranging from a view of every comment made in the survey to a ranking of the most common single word, two-word combinations, and three-word combinations. You can search for specific words and phrases or by predefined themes; you can also generate real-time word clouds and investigate comment hot spots.
Hot Spot Report: Helps you quickly identify pockets of respondents whose scores are significantly higher or lower than those of other respondents.
Summary Report: Provides a summary of all the category and item results from your survey.
Demographic Crosstab: Enables you to break out results for questions or categories by demographic and compare results for demographic groups side by side.
Benchmark Report: Displays question/category scores compared to benchmark(s) where available.
Completion Report: Shows a breakout of response rate information by demographic groups.
NPS Report: Displays the Net Promoter Score (NPS) for the organization or scope of view within the data.
Demographic Profile: Displays the percentage of respondents by all available demographic options.
Survey Results: Shows a view of all the response data totaled and displayed by question.

Filter Your Data
You can use the Filter Data feature to dig deeper into results and analyze results for specific segments of the respondents. Filters apply demographic variables to the survey data; only the results that match your filter criteria display.
After you create a filter, you can save it and retrieve it at any time. When you want to return to your full set of results, simply clear the filter.
For more information, see the Filter Your Data article.